What is Workplace Analytics?
Workplace Analytics uses data from Microsoft 365 applications to identify collaboration patterns from everyday work that impacts employee engagement, productivity, and effectiveness.
The data can help us investigate and answer specific business questions and can give us the flexibility to look at data from multiple perspectives, such as by tenure, role, department, location and so on. We will explore some of these metrics below to understand how they can be used to enhance wellbeing, productivity, and employee engagement in organisations. We will also touch on how this rich data source can be used in combination with more advanced analytical techniques, such as machine learning algorithms to cluster employees based on different work habits.
How can we use Workplace Analytics to bring change to organisations?
To support wellbeing
Studies suggest that long working hours contribute to higher risks of developing cardiovascular diseases, chronic fatigue, stress, among other issues. Concerns towards long working hours have only become more prevalent since the start of the COVID-19 pandemic, as more employees are working from home which has blurred the lines between work life and home life. As a result, organisations are trying to find new ways to mitigate these issues and encourage a better work-life balance to support this new way of working. With the person query inside Microsoft’s Workplace Analytics platform, analysts can collect data on after hours collaboration, such as emails, calls, instant messages or meetings that have taken place outside of the core working hours set out in Outlook calendars. Analysing this data can help organisations understand whether they need to establish communication guidelines, introduce new health initiatives, or set new boundaries for certain groups of employees to support their wellbeing. Furthermore, if a department consistently has after-hours collaboration, this can be an indicator of under-capacity in a group, so hiring new employees in particular areas may be needed to support this.
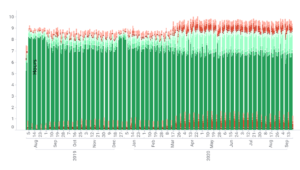
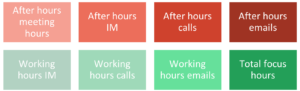
Figure: Graph showing the number of hours spent on different activities during working hours vs after working hours.
To create workplace personas and identify distinctive habits
Using workplace analytics data, we can also build clustering models which can help us understand whether data points can be grouped together based on similar patterns. We can then explore the make up of these clusters or groups, to identify and compare the key meeting behaviours across different offices. This can help us to understand how organisations typically operate, and whether there is a significant group of meetings that contain poor habits and requires further attention. These algorithms could also support work on generating workplace personas by grouping employees together based on certain work habits and with more evidence-based and measurable insights. Generating insights from Microsoft 365 data to support these personas would make workplace strategies more reliable, as they are based on objective data collected from employees over a long period of time, with the ability to pick up more organic behaviours.
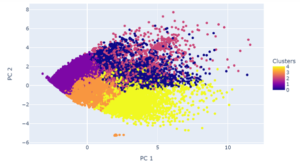
Figure: Visualisation showing five different clusters of meeting behaviours (after using a dimensionality reduction technique).
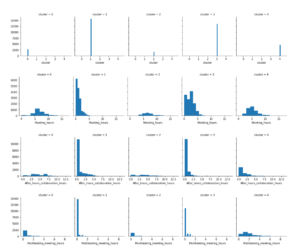
Figure: Histograms illustrating some of the contents of each cluster.
To enhance managerial effectiveness
Other metrics include observing meeting hours that individuals had with their manager. Analysing this data can help organisations understand whether their managers have enough contact with their direct reports to be effective leaders, as research shows that effective management can be achieved through employees having recurring 1:1 meetings with their managers for 30 minutes at least twice a month, enabling more positive employee engagement. Another way to achieve effective management is through reducing meeting co-attendance, another metric that can be analysed to understand managerial effectiveness. A very high proportion of time in meetings with managers can indicate a culture of micro-management or lack of trust, so reducing co-attendance rates can allow dependents to become more autonomous and leaves more time for managers to complete individual tasks. Further analysis can reveal how time with managers compares by job role, office location and employee tenure, to provide more detailed insights to determine if there are opportunities for improvement in any specific area of the organisation.
To understand meeting culture and productivity levels
Having access to this data also allows analysts to gather metrics on low quality meeting hours, which includes the number of meeting hours in which an attendee multitasked, attended a conflicting meeting or attended a meeting that exhibits redundancy. Collecting data on low quality meeting hours is massively beneficial to organisations, especially for those that are moving to hybrid working, as it is a good indicator of meeting culture and can help identify opportunities to make meetings more effective or engaging. For instance, multitasking during meetings can be a sign that attendees are not contributing at their full potential which may significantly reduce productivity. Furthermore, redundancy can indicate a lack of role clarity or poor delegation by more senior staff, which could potentially result in employees feeling less empowered.
Through this query, we can also set the hourly rate of meeting time to understand the average cost of low-quality meetings hours. This is an important metric to track, especially as growing research suggests that low quality meetings are costing organisations millions a year. For instance, a study by Doodle in 2019 in the State of Meetings report, suggested that poorly organised meetings could have costed companies $399 billion in the U.S. and $58 billion in the U.K. in 2019 alone.
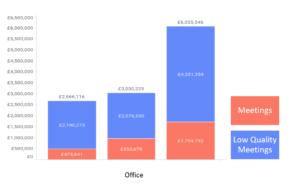
Figure: Cost of meetings vs low quality meetings by office location.
To build employee networks
With Workplace Analytics, we can also analyse the internal network connections between different people exclusively within a company, for example, between the IT department and HR department. This query includes metrics such as internal network breadth between different groups, which can give a good indication that a company has high levels of cross-function collaboration or whether silos exist within a company with low network breadth. Through the internal breadth and diverse ties metric, organisations can also understand, for example, the success of on-boarding programs for new employees by comparing the internal network breadth of newer employees to more established employees. It can also indicate whether diverse enough ties in the company exists to circulate fresh and varied sources of information from across the company to certain groups. With more widespread and diverse ties in an organisation, employees are more likely to feel engaged in their role, and innovation is more likely to occur due to having better access to a varied range of knowledge assets.
Another metric, on external collaboration, shows a summary of employees’ network patterns with people outside the company. We can use this to understand how certain groups of people within a company spend their time interacting with people in external domains, such as customers, business partners, or suppliers. This metric could be useful in understanding how successful the Sales teams are, for example, in their outreach to support their organisations visibility and value proposition, and whether external collaboration has been impacted since the beginning of the pandemic.
Conclusion
This blog hopes to highlight some of the many benefits of Microsoft’s Workplace Analytics platform and the kinds of insights that we can generate using the data at UnWork. By analysing the data, we can create actionable insights to cut costs, boost productivity levels, identify opportunities to improve managerial effectiveness and make your business more successful. We can also find out how people spend their time and who they spend it with, to identify siloes or employees that are better connected and have greater potential to drive positive change in an organisation. Overall, by using Workplace Analytics we can reveal surprising new insights about the nature of work and how it gets done, allowing organisations to predict the impact of their everyday actions, with long term benefits.