As we have all rapidly become accustomed to working from home during the COVID-19 pandemic, it is easy to forget that this will eventually change. This is not the end of the office, although its function and form are going to change in response to new pressures as they always have. Offices will adapt to be more about coming together and collaborating and less about space for individual work. Activities that have to take place in the office will, but there is likely to be a component of remote working retained in the future office. At UnWork we have found that most companies are likely to have a certain proportion of employees working remotely roughly 2-3 days per week.
This will cause a huge change in the amount and types of spaces required by users and consequently, a significant change to the amount of space required by organisations as they move back into their offices with a significant proportion of the workforce working several days per week from home. Many will re-evaluate their real estate portfolios as they begin to realise that previously underutilised offices will now be sitting practically empty.
This article will examine how a typical future office could look with different proportions of the workforce working for 2.5 days from home. This represents a sensible mid-point between the estimates that we have been observing. The models this article will examine are:
| Model | Description |
| Pre-COVID | The situation before the COVID-19 pandemic began |
| Post-COVID A | 30% working remotely for 2.5 days per week |
| Post-COVID B | 50% working remotely for 2.5 days per week |
| Post-COVID C | 70% working remotely for 2.5 days per week |
| Post-COVID D | 90% working remotely for 2.5 days per week |
Figure 1: Remote Working Models
Desk Utilisation:
UnWork data from multiple occupancy studies all over the world has shown that on average, office desks only have someone actually sitting in them for 40% of the time. Even when we include desks that look like they have been used recently (e.g. with a hot cup of coffee or a logged in computer) that figure only increases to 58%.
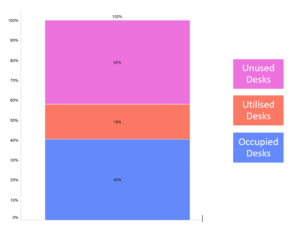
Figure 2: Average desk occupancy, utilisation and unused desks. Data from UnWork research.
The purple in Figure 1 represents desks that are not being used at all on average. This was the situation before the COVID-19 pandemic began. When we return to the office with increased remote working, the purple section will depress the blue and red yet further, creating offices with extremely low occupancy. Using our existing data and modelling what the impact of increased remote working would be on the population of a typical 800-person office, we have constructed the following model:
Model |
Max Utilisation | Desks | Meeting Room Seats | Informal Meeting Seats | Total Seats |
| Pre-COVID | 72% | 800 | 543 | 171 | 1514 |
| Post-COVID A | 61% | 576 | 170 | 470 | 1216 |
| Post-COVID B | 54% | 488 | 154 | 528 | 1170 |
| Post-COVID C | 47% | 376 | 148 | 586 | 1110 |
| Post-COVID D | 40% | 320 | 135 | 643 | 1098 |
Figure 3: Remote working models and workspace counts
Figure 3 shows a client of UnWork that had a fixed desk model. Their maximum utilisation figure shows that even at their busiest point they had too many spaces that were not being used. By applying a linear reduction in utilisation proportional to the amount of home working in each model and using our typical activity based working (ABW) calculations, we can see that the overall number of seats is going to reduce drastically. This modelling assumes that there is a level of desk-sharing as without this you always need at least as many desks as people.
When begin to look at how this changes the amount of office space required, it shows that there are significant cost savings to be made through reducing the number of workspaces required in anticipation of hybridising remote and office working.
| Model | Max Utilisation | Typical Total Space Requirement (m2) | Space Saving From Pre-COVID (m2) | % Change | Cost Saving |
| Pre-COVID | 72% | 3661 | N/A | N/A | N/A |
| Post-COVID A | 61% | 2180 | 1481 | 40% | £ 1,788,136 |
| Post-COVID B | 54% | 2022 | 1640 | 45% | £ 1,980,032 |
| Post-COVID C | 47% | 1885 | 1776 | 49% | £ 2,145,192 |
| Post-COVID D | 40% | 1732 | 1929 | 53% | £ 2,329,866 |
Figure 4: Indicative space and cost savings by model
Figure 4 gives indicative space savings using a streamlined model that is overestimating the size of some of the components. This saving is therefore likely to be a minimum, with a more detailed analysis identifying even further savings. This model contains several assumptions and caveats:
- The cost saving given is based on London average office occupancy costs, so will be location dependent.
- These models apply a linear level of remote working to a random proportion of the workforce. This means that the utilisation level used for calculating seat numbers is not exact as different teams will have a different remote working tolerance.
- Space is calculated as the space for each worksetting plus 20% circulation. It does not cover other workplace elements such as pantries, server rooms or toilets.
This analysis shows that a hybrid office and remote working environment can result in significant space and cost savings to organisations who choose to follow this approach, provided the correct analysis is conducted beforehand. Whether it is cost saving to ensure a company remains viable or space saving to do something more with what is there, using this approach to deal with the effects of COVID-19 will be beneficial for many companies. UnWork’s detailed analytical approach can help to unlock these benefits through a quantitative understanding of how your company operates and our vast knowledge and experience working with a diverse range of companies to improve their workplaces.